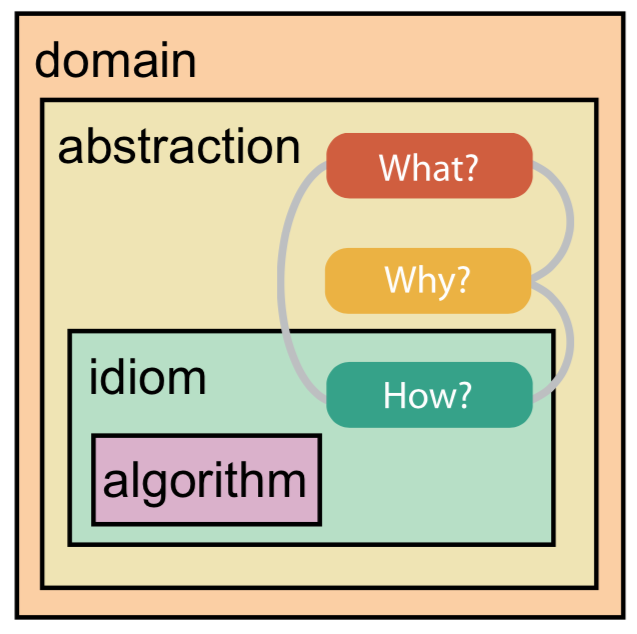
A good data visualization that resonates with the intended audience requires careful thought of an appropriate design space. A what-why-how Analysis Framework can be used as the scaffold to think systematically about such a space. The framework has a topology of four levels and asks three questions.
- A domain situation that describes the target users and consumers of information.
-
A problem abstraction that
translates the specifics of the domain to the
vocabulary of vis or
grammar of graphics. This includes
- What is shown? Or, the data abstraction
- Why is the user looking at it? Or, the task abstraction
-
An idiom for the visualization.
This describes
- How is it shown? This can be a visual encoding idiom (how the data is presented) or an interaction idiom (how the data is manipulated)
- An algorithm for the efficient computation and display of the data.